热门资讯> 正文
每周回顾:市政债券CEF-10年期国债收益率跌至2017年以来最低水平
2019-05-30 08:25
- 太平洋投资管理市政收益基金2(PML) 0
- Nuveen Connecticut Quality Municipal Income Fund(NTC) 0
- Nuveen Municipal High Income Opportunity Fund(NMZ) 0
The investors changed their focus to safer assets due to the uncertainty around the trade deal and the volatility on the stock market.
We continue to follow the most important yields and municipal/Treasury spread ratio.
Most of the funds from the sector are traded at positive Z-scores, and we do not see a statistical edge to include some of them to our portfolio.
Over the past few months, most of you have noticed our increased activity in closed-end funds as the inflow of volatility finally shook them up and created various arbitrage, and directional, opportunities for active traders like us.
Currently, we are cautious when we choose our long positions as most of the closed-end funds which hold municipal bonds have lost their statistical edge and are traded at positive Z-scores. However, there are several interesting pair trade opportunities which can be traded. For the conservative market participants with longer investment horizon, I still see interesting dividend opportunities which are traded at high discounts.
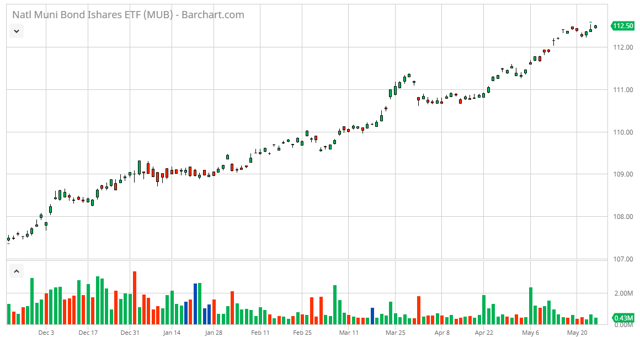
Once again, the benchmark of the municipal bonds showed how strong is the impulse of the current upward trend. On a weekly basis, the iShares National AMT-Free Muni Bond ETF (
MUB
) remained in a green territory with a $0.07 increase in its price.
The main index started a new uptrend at the beginning of November 2018 and continues to conquer new highs. The last time when we saw the benchmark traded at these levels around $112.50 per share was in October 2016.
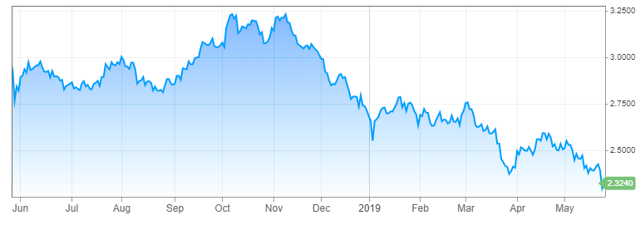
The 10-year Treasury yield dropped to lowest levels since 2017 last week as trade war fuels economic worries. Generally, the falling of the yields is a positive fact for the municipal bond closed-end funds as they hold assets with relatively high duration.
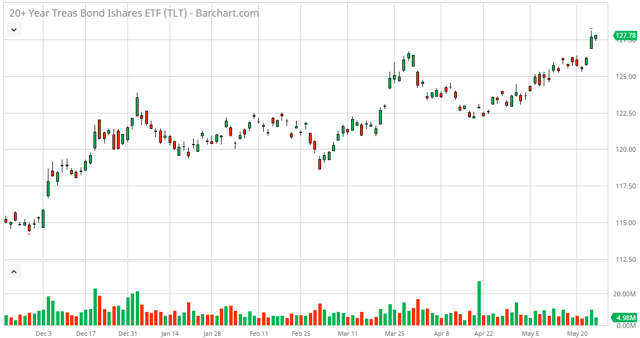
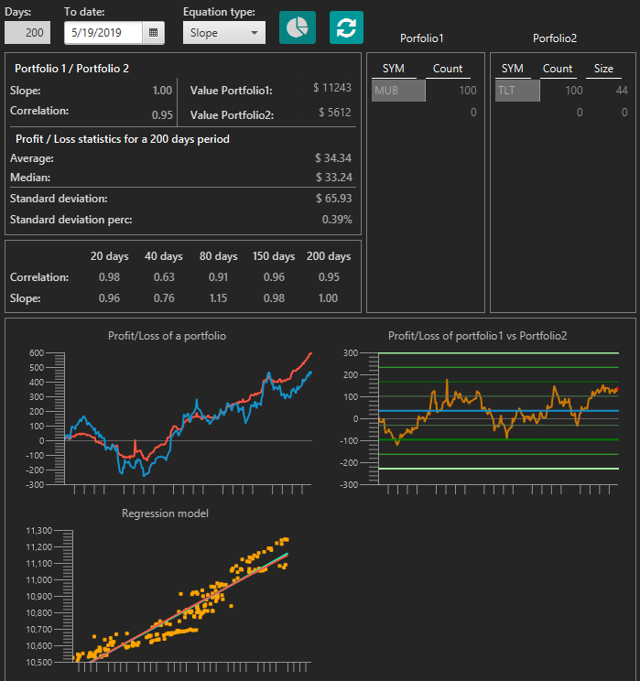
As you know, we follow the performance of the U.S. Treasury bonds - considering them a risk-free product - with maturities greater than 20 years: the iShares 20+ Year Treasury Bond ETF (
TLT
). The reason for that is the strong correlation between these major indices, and the chart below proves it. Additionally, a statistical comparison is provided by our database software:
Investing in municipal bonds is popular because they have the potential to offer higher yields than similar taxable bonds. If an investor wants to know whether muni bonds are cheap in comparison to taxable bonds or Treasuries, they could find out by comparing them. However, this method does have its limitations, and the investor should perform a more thorough analysis before making a decision:
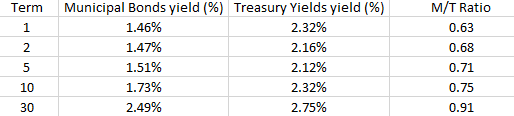
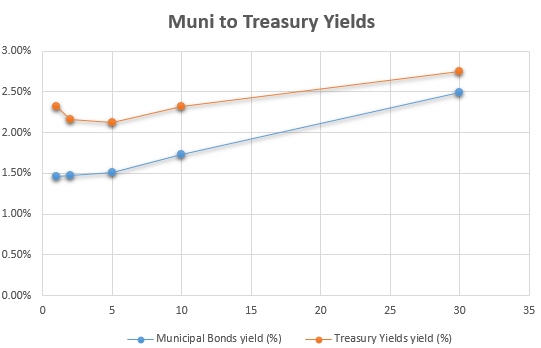
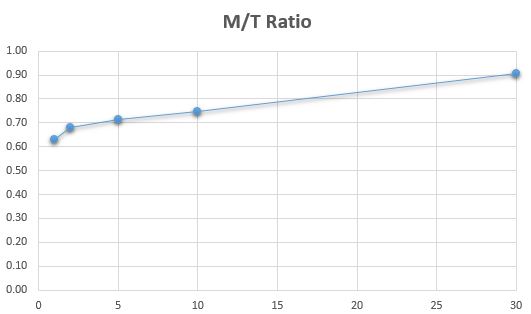
The Municipal/Treasury spread ratio, or M/T ratio as it is more commonly known, is a comparison of the current yield of municipal bonds to U.S. Treasuries. It aims to ascertain whether or not municipal bonds are an attractive buy in comparison. Essentially, an M/T ratio north of 1 means that investors receive the tax benefit of muni bonds for free, making them even more attractive for high net worth investors with higher tax rate considerations.
The narrowing spread and 3-month LIBOR are important for the leveraged municipal funds, and they can be highly affected by them. The 3-month LIBOR rate is a commonly used funding benchmark for the municipal bond CEFs.
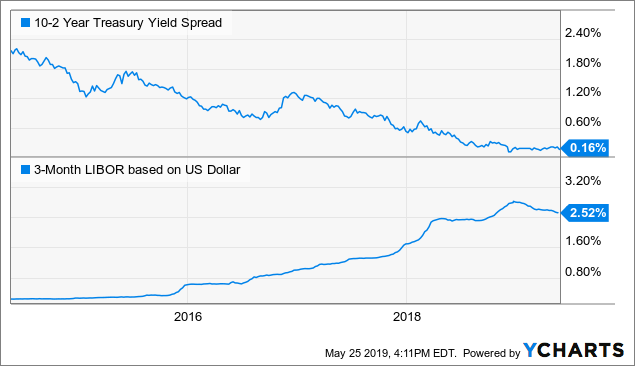
Data by YCharts
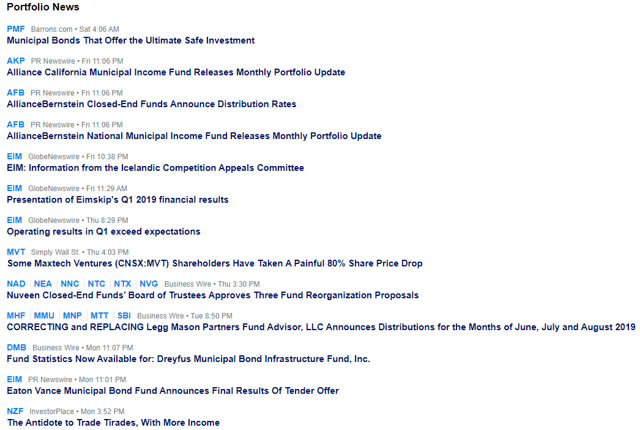
Several funds announced their regular dividends:
The Board of Trustees for six Nuveen municipal closed-end funds approved three merger proposals.
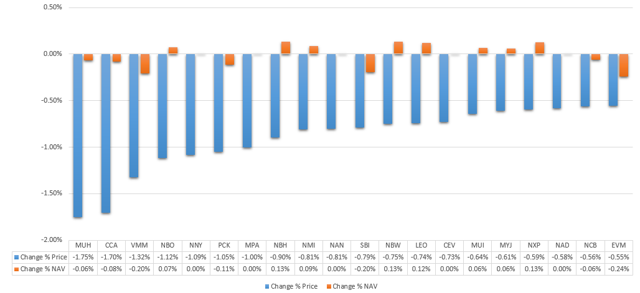
1. Biggest price decrease
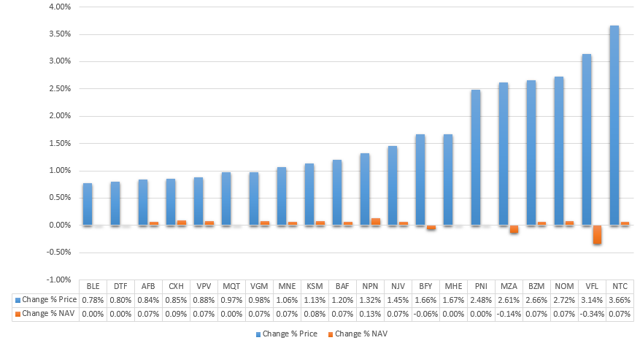
2. Biggest price increase
1. Lowest Z-Score
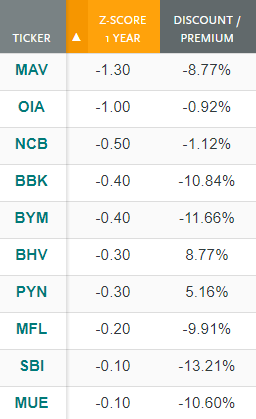
The first criterion which is part of my analysis is the Z-score of the closed-end funds from the sector. It is a statistical approach which helps us to figure out how many times the discount/premium deviates from its mean for a specific period. Respectively, if the Z-score is negative, we can talk about a statistical edge to buy the funds. It is getting even better if we combine the statistical indicator with an attractive discount in order to review the fund as a potential
"Long"
candidate.
If you follow the performance of the municipal bonds and closed-end funds which invest in such kind of bonds, you will not be surprised if I tell you that currently, it is difficult to find statistical edge among the funds. This fact is just a consequence of the significant increases in the prices of the closed-end funds over the past several months.
Pioneer Municipal High Income Advantage Trust (
MAV
) continues to lead the ranking with its Z-score of -1.30 points. The fundamental reason for the decrease in the price could be found in the recent dividend cut. The management team decided to decrease the distribution in February from $0.0525 to $0.0425 per share in an attempt to improve the earning coverage ratio of the fund. Since that moment, the price of the funds is under pressure and does not find a way to go up.
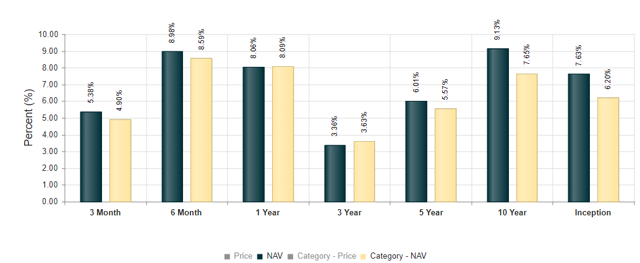
My personal favorite from this table is BlackRock Municipal Bond Trust (
BBK
). The reason behind its Z-scores is identical. In March, the dividend was decreased from $0.0635 to $0.0545 per share. However, the current yield of the fund is 4.52%, which is still very competitive for this sector. The past results of this municipal closed-end fund are more than satisfying which is an indicator for the quality of the management team. Over the past decade, BBK managed to outperform its peers by return on net asset value. On the chart below in dark blue, you can follow the performance of BBK compared to its peers which are in yellow.
2.
Highest Z-Score
The main aim here is to show us which of the funds are statistically overpriced at the moment. Ideally, to find a reasonable "
Sell
" candidate, we would like to have a statistical edge accompanied by a premium or price pretty close to the net asset value. Unfortunately, I still do not see interesting opportunities for
"Short"
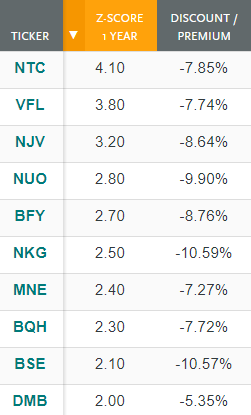
candidates because the funds are traded at discounts. However, if you hold a long position in some of the funds which are traded above 2.00 points Z-score, I will recommend you to close it and wait for another good entry point to buy them.
Delaware Investments National Municipal Income Fund (
VFL
) was one of the Munis which I recommended in February as an interesting buying opportunity. Definitely, the fund impressed us with a very solid performance over these three months. Currently, we see it as statistically overpriced, and we think it is a good moment to close your position and to re-allocate your funds to Nuveen Quality Municipal Income Fund (
NAD
). NAD and VFL have a very strong correlation between their net asset values, but the current price yield of NAD is 4.68%, while VFL offers 4.45%. NAD is traded at 11.65% discount. Its Z-score is only 0.40 point. My opinion is that NAD is the more rational choice at that moment.
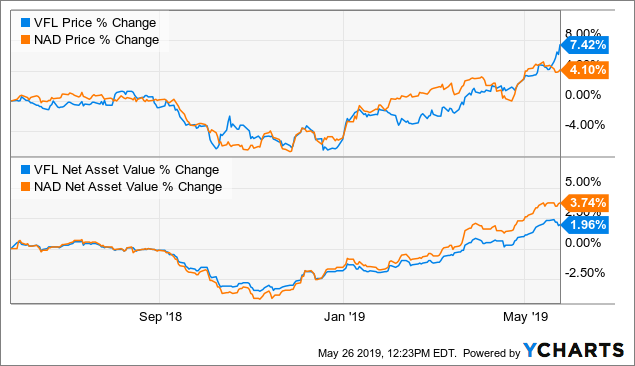
Data by YCharts
Nuveen Connecticut Premium Income Municipal Fund (
NTC
) is traded at extremely high Z-score of 4.10 points after the announcement of the approved merger proposals by the board of trustees of Nuveen. If shareholders approve the reorganization, Nuveen Connecticut Quality Municipal Income Fund shareholders will receive a cash distribution prior to the closing of the reorganization of approximately 10% of net asset value per share.
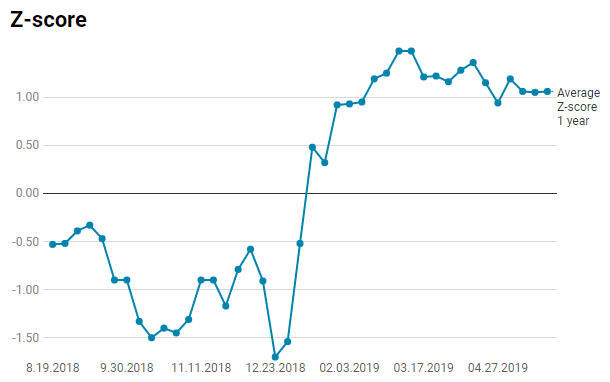
The average one-year Z-score in the sector is 1.06 points. Last time, the average Z-score of the municipal sector was 1.05 points.
3.
Biggest Discount
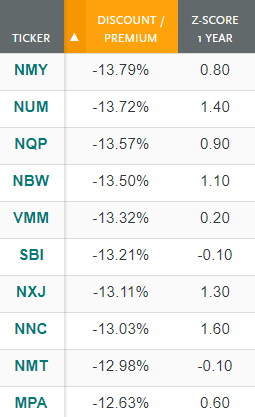
Still many of the funds are traded at a discount of more than 12.00%. Very quick research will show us that most of them are state-specific. The national Munis are currently traded at a smaller discount, most probably due to their diversified portfolio.
From the above table, Nuveen Massachusetts Premium Income Municipal Fund (
NMT
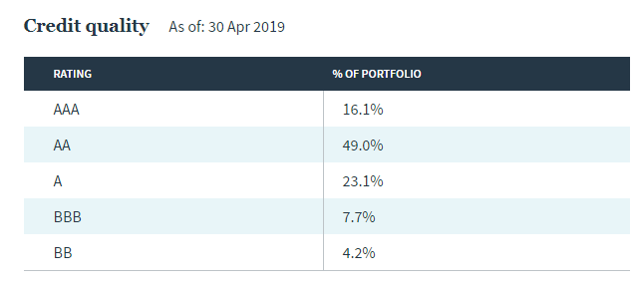
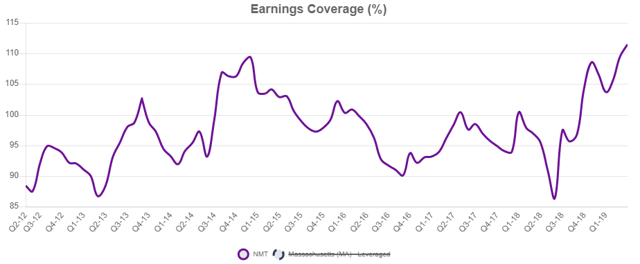
) is one of the interesting options. It's a state-specific municipal CEF which invests mainly in Massachusetts. From its portfolio, 92.80% of the investments are from issuers from this territory. Talking about credit quality, I see only positives as 95.8% of the assets are labeled as "investment grade" and 49% of them are with a rating of "AA". The current yield of the fund is 3.86%, which is not among the most appetizing ones, but the earnings coverage ratio of the fund is 111.46%, which is a positive indicator for the dividend and can be perceived аs margin of safety for the future distributions.
4.
Highest Premium
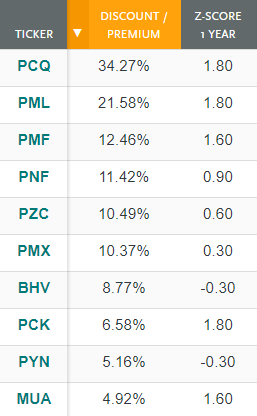
In the above table are the funds which are trading above their net asset values. Theoretically, the participants which are traded at a high premium should be reviewed as potential
"Short"
candidates, but you need to be careful with PIMCO funds. The market pays a premium for them on a regular basis. When the Z-score is between 0 and 1.00, we do not have a statistical reason to sell any of these funds.
My personal suggestion is to avoid long positions in funds which are traded at a premium accompanied by Z-score above 1.50 points. In our case, we have PIMCO California Municipal Income Fund (
PCQ
), PIMCO Municipal Income Fund II (
PML
), PIMCO Municipal Income Fund (
PMF
) and BlackRock MuniAssets Fund (
MUA
), which are overpriced, based on my criteria.
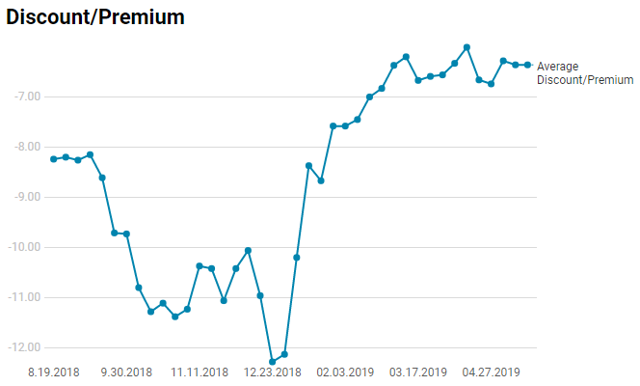
The average discount/premium of the sector is -6.22%. Last time, the average spread between the prices and net asset values of the funds was -6.36%.
5. Highest
5-year Annualized Return On NAV
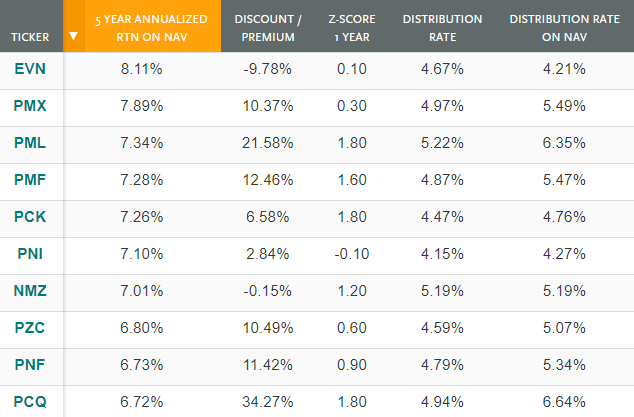
The above sample shows the funds with the highest return on net asset value for the past five years. The average return for the sector is 5.11%. From the above participants and their parameters, only PIMCO New York Municipal Income Fund II (
PNI
) and the Eaton Vance Municipal Income Trust (
EVN
) caught my eye with their relatively low Z-scores.
6.
Highest Distribution Rate
:
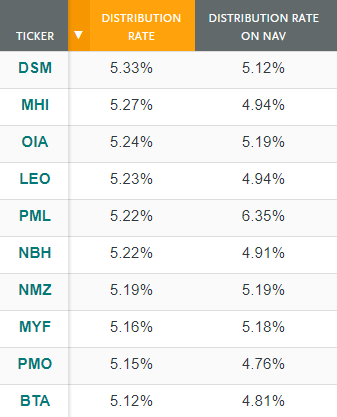
The average yield on price is 4.42%, and the average yield on net asset value is 4.15%. Of course, each of us wants to achieve a higher return, but you need to pay attention to the fundamental analysis and to avoid these ones which are threatened by dividend cuts.
Neuberger Berman Intermediate Municipal Fund (
NBH
) is a very example where you should be cautious. The latest earnings per share of $0.0550 is not enough high to cover the dividend of $0.0624 per share. In other words, the earnings/coverage ratio is 87.76%, and the fund needs to use its UNII balance to maintain its dividend. When the UNII balance amount is used up and earnings/coverage ratio is still negative, we can expect a dividend cut.
Nuveen Municipal High Income Opportunity Fund (
NMZ
) is the fund which caught my attention in a positive way. It offers 5.19% current yield, and its dividend is fully covered by the earnings. On top of that, the UNII balance per share is in green territory.
7.
Lowest
Effective Leverage %
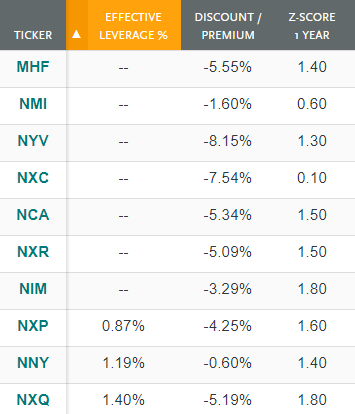
The average effective leverage of the sector is 36.2%. Logically, most of the funds with lower effective leverage have lower distribution rates compared to the rest of the closed-end funds. Seven funds from the sector have effective leverage equal to zero.
Compared to the previous years, the discounts of the closed-end funds holding such products have significantly widened, but we remain cautious when we select our long positions due to the high Z-scores in the sector. However, there are several interesting pair trades which you can review.
I/we have no positions in any stocks mentioned, but may initiate a short position in PCQ over the next 72 hours.
I wrote this article myself, and it expresses my own opinions. I am not receiving compensation for it (other than from Seeking Alpha). I have no business relationship with any company whose stock is mentioned in this article.
推荐文章
美股机会日报 | 止跌企稳!纳指期货盘前涨约0.5%,有分析称美股连遭重挫后或回升;亚马逊盘前大跌超8%

一周财经日历 | 事关降息!美国1月非农、CPI数据下周公布;恒指季检结果下周五揭晓
华尔街大多头漫谈黄金“黑天鹅”风险:马斯克实现太空采金,化身全球央行行长
避险情绪席卷市场 华尔街青睐的热门交易纷纷崩跌
华盛早报 | 无一幸免!美股、金银、加密货币与原油集体崩盘;南向资金爆买250亿港元!创约半年来新高;千问APP今日启动30亿免单
亚马逊股价盘后大跌近10%,巨额资本支出引发担忧
比特币暴跌带来124亿美元巨亏 Saylor的金融实验岌岌可危
2月6日外盘头条:比特币暴跌 亚马逊预计今年资本支出将达2000亿美元 交易员料美联储将比预期更早降息
