热门资讯> 正文
J. C. Penney: I Am Buying The Debt Securities Being Sold - Here's Why
2019-06-04 21:40
Recently, an article appeared in Seeking Alpha, forecasting a bankruptcy filing for JCP at the beginning of Q4.
Another recent article suggested that J. C. Penney debt was \"untenable\".
In articles and commentary, a significant justification for the current market pricing on JCP debt is their current market pricing, reflecting the market\'s view that bankruptcy is imminent.
Some metrics used in other articles are revisited below to see whether earlier conclusions about imminent bankruptcy are compelling or not.
These claims about bankruptcy don\'t have to be wrong, just premature, for buyers of JCP debt at current prices to generate significant gains.
1. This analysis does not reveal a cause for an imminent bankruptcy as highlighted in other articles.
2. While many commentators indicate that the board could file a voluntary bankruptcy, this analysis shows that an involuntary filing is not needed or justified prior to 2023 (when a significant amount of debt must be refinanced and about which some questions could be raised about whether that will or will not happen).
3. This analysis shows that a zero recovery for unsecured debt is very unlikely, given the real estate holdings of J. C. Penney (
JCP
) would provide some to complete recovery (the degree of the recovery would be a source of debate), even for the unsecured debt.
4. When one evaluates a retail entity, given the seasonality of revenue, earnings, cash flow, payments to/from the entity and other metrics, one should utilize a four-quarter trailing metric, to represent what the current state of the retailer is, rather than annualize the latest quarter. First quarter results (or any quarter's results) do not represent accurately the financial results for a retailer, given the very significant seasonality, over the yearly selling cycle. Therefore, use of such estimates may lead to excessive pessimism or optimism about the security, unwarranted by actual performance over the entire year.
Actions Taken:
On May 31st, the Owl increased the position in KTP by a third (based upon shares purchased) at prices at $5.75/share KTP or less (used limit orders below $5.75/share). At this price, the full purchase price of the security will have been fully recovered after six interest payments. Since the view of this analyst is that any bankruptcy would be necessary in the second half of 2023 (i.e., after eight interest payments), buyers at this price will have received interest payments at least equal to their original investment. If one would go into a hypothetical bankruptcy at that point (if at all, itself a question), with a zero basis and good odds on a significant recovery, based upon liquidation of the real estate.
Over a year ago, I wrote an article ("
Is J. C. Penney Really Comparable to Sears Holdings
", published April 22nd, 2018) contrasting the performance of Sears (
OTCPK:SHLDQ
) and J. C. Penney. In this article, the thesis put forward at that time by many analysts was tested, looking at the numbers each company was delivering, to determine whether these two companies were truly similar and would truly meet similar fates (i.e., bankruptcy) in a similar time frame. The conclusion of the article was that they would not meet the same fate, at least in any similar time-frame: we now know that SHLD has now filed bankruptcy and is in the midst of a re-organization and JCP has not (yet).
Now, the risks attendant to owning JCP debt, exchange-traded debt securities (I use
KTP
because of a higher coupon and more liquidity, but others exist like
PFH
,
HJV
,
JBN
, and
JBR
), and equity have been highlighted again in two recent articles:
a.
"Tariffs Could Push J. C. Penney Into Bankruptcy"
b.
"J. C. Penney's Debt Is Untenable".
One indicates an imminent bankruptcy while the other implies significant distress (not predicting bankruptcy but implying a risk), supported by a metric that indicates a "14X debt to EBITDA" and "negative free cash flow" based upon the Q1'19 earnings report. We will return to these points below.
Let's start with a simplified balance sheet to see what JCP owns and owes:
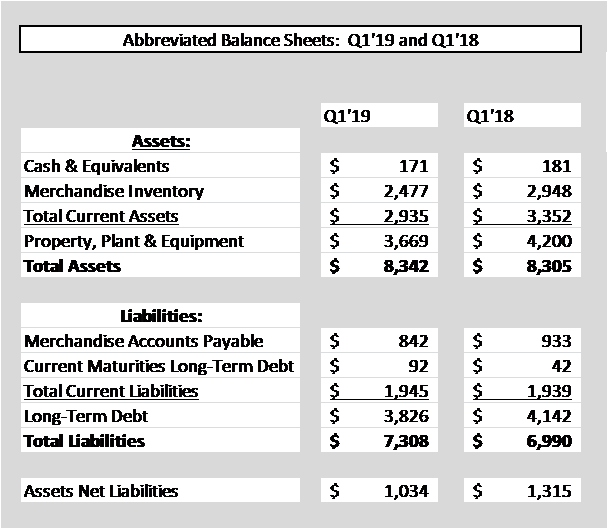
A typical first evaluation looks at bottom of the sheet to determine assets net of liabilities. Assets net of liabilities dropped significantly year over year, a trend that is concerning.
About half of the decline in assets appears to be due to a sale-leaseback of the company's headquarters that did not go well. An impairment of half of the $300m-ish difference was taken as part of this transaction.
Let's look at a longer trend, pulled from the earlier article referenced above:
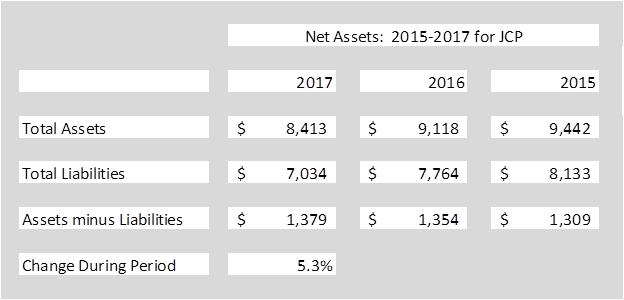
Here we see that, over the long run, net assets had been stable through a substantial portion of the "retail apocalypse". That assets are now declining is concerning and this analyst would prefer to see this trend stabilize in upcoming periods. However, does this recent decline suggest an imminent bankruptcy?
To answer that question, let's look at the decline and state of assets for a company, SHLD, that has actually filed to see what financial stresses are needed to prompt their filing. Here is that view, pulled from the same, earlier article:

So, SHLD hit a level of a negative $4B or so prior to bankruptcy (as opposed to $1B positive assets for JCP at this time) and had carried negative net assets for years prior to that point.
So while I am concerned that JCP assets are declining, it is not obvious to me that JCP has hit a point where a filing is needed based upon assets, relative to a similar company in the same industry that has actually filed.
One of the referenced articles expressed a concern about the EBITDA run rate, annualizing the Q1 result to calculate a "debt to EBITDA" ratio of 14 times.
I had expressed above reservations about annualizing single quarter results for retailers, and this is an example where doing so may lead to errant conclusions.
Here is the 4Q run rate (that was actually delivered) by JCP over the past year:

As we see, if you include all of the quarters in the retail year, EBITDA looks significantly different than a one quarter annualization. I argue that this offers a much better representation of the current state of JCP than the one quarter approach taken elsewhere.
I have also taken the liberty to calculate a new net debt (net of cash) to EBITDA ratio and it appears to be about half of the ratio calculated elsewhere.
So, again, would I be concerned about this level of debt? Yes, as those who have read any other articles know that I advocate for lower leverage. However, does this leverage level indicate an imminent bankruptcy? Better to ask this question: Where was Sears prior to their filing?
In the five years prior to their filing (found on Sears Holdings IR site in their 2017 Annual Report), Sears had run a negative EBITDA, so the ratio would not apply to their case. Sears had a sum of $3.4B of negative EBITDA in the five years prior to their filing and delivered a minus $526M in 2017, the year prior to their filing. This cumulative impact of earnings losses had eroded their assets to a large negative number (again, nearly $4B net asset hole) which is not similar to where JCP is today.
Anything is possible, but there is not an argument to be made that the current state of JCP should lead to a legally-supervised re-organization imminently. There are quantitative arguments that 2023 may create difficulties, given the large sums to be refinanced, but the argument that a filing is imminent is substantially less compelling.
In cases of distressed operations, cash flow is critical, especially cash flow from operations. Cash flow is the lifeblood of companies, so it is critical to review cash flow from operations (and free cash flow, in the next section) to see if there are signs of imminent distress.
Please find here a summarized cash flow statement for the first quarter periods for 2019 as compared to 2018:
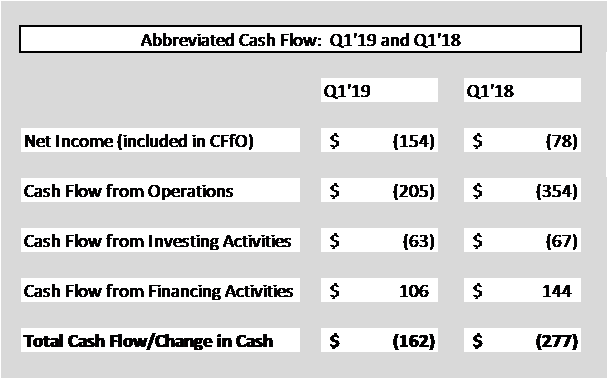
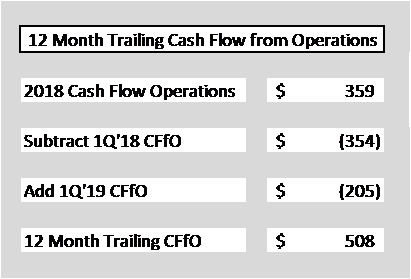
Again, we see that first quarter delivers consistently weak results. In order to determine how representative these results are to overall performance, one needs to evaluate the trailing 4Q cash flow from operations, found here:
If you wanted to argue that a shortage of cash flow would prompt a bankruptcy filing, 2018 was the time to do it. Q1 cash flow from operations appears to be consistently negative, but 2018 looks substantially weaker than 2019. Comparing Q1 results to full-year results demonstrates, again, why one quarter annualizations (in retail) do not necessarily present a representative view.
The trailing 4Q cash flow from operations yield about half a billion dollars of cash which can be used to pay down debt, improve stores, be used to invest in omnichannel strategies or to be held in the Treasury for the difficult days to come.
Keep in mind that cash flow from operations already reflect interest expense as that comes into the cash flow statement through net income. That is, the $508M is cash into the Treasury AFTER having paid the interest, servicing the debt.
"Ah, but Owl, you sneaky rascal you, don't you realize that you need to look at free cash flow which has been reported to remain negative?". Actually, yes I realize that, so let's consider free cash flow next.
Free cash flow has been reported elsewhere to be negative. Now, it is true that free cash flow was negative in Q1 (since cash flow itself is negative in Q1, FCF must be negative as well). I think if I went back, it would be negative in Q1 for several years.
Again, let's consider evaluating it using the 4Q trailing prism:
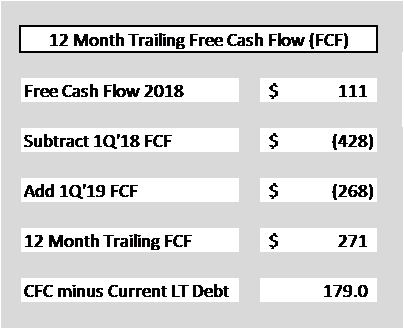
Not only is the 4Q trailing FCF not negative, but it is also substantially higher than I believe anyone has pointed out.
I have also taken the liberty to compare the free cash flow generated over the past four quarters with the upcoming debt payments (not interest, as they are already paid out of net income, subtracted prior to the cash flow statement) of $50M in October plus four quarterly payments of $10.55M, totalling $42M. This sums to the $92M that JCP reports as current debt due for 2019. After having paid for the debt redemptions claimed to be so troublesome, $179M in free cash will remain (AFTER the debt redemptions are complete). This would be enough to knock out the 2020 maturity as well.
Interest expense for JCP for the trailing 4Q period was:

Interest expense continues to drift lower, dropping by $5M annualized since Q4'18. The decline is not necessarily significant per se, but the fact that it is not increasing is significant and important for the future of JCP.
There are two key reasons, related to leverage, why companies go bankrupt:
a. One cannot service interest
b. One cannot redeem upcoming maturities
Interest expense currently incurred is shown in the table to be easily affordable and able to be covered for the foreseeable future. The 4Q trailing interest expense of $308M is easily covered by the $508M in cash flow from operations (cash flow AFTER the interest expense has already been paid). In other words, there is about 250% coverage on interest expense for JCP based upon the last four quarters. Interest coverage does not appear to be a source of distress for the foreseeable future.
There is an argument that can, and has, been made that JCP may struggle a bit with upcoming maturities in the 2023-2025 time period. We will return to this below.
If the threat is not servicing interest expense, then there must be a concern around the ability to redeem upcoming maturities (or be able to refinance them). One can use the following table of debt maturities to highlight the risks currently perceived:

This table highlights five key elements:
a. The 2017 credit facility has a lending capacity of $2.3B but is limited by eligible receivables securing the loan. As of the most recent 10-Q, however, there was about $1.6B in borrowing capacity remaining on this facility to be used to finance inventory and other goods needed. It is also used to secure letters of credit and import letters critical to a retailer. Concerns about the ability to fund on-going operations, with this capacity available to fund them, appear to be overblown. Only the case where their business drops off substantially so that there are not eligible receivables against which to borrow would this tranche create borrowing problems for JCP. There remains more than enough capacity for JCP to continue operations. Given that this is a facility secured with receivables, it would be likely to be "rolled over" in 2022, albeit perhaps under different rates and limits.
b. The 2016 credit facility has required payments of $10.55M per quarter, so the balance on this facility will drift downward by about $140M by the time it matures. This facility is backed and secured by some JCP properties.
c. The Senior Notes due 2023 and 2025 will be the key maturities with which JCP will need to deal that pose the greatest threat to the long-term sustainability of JCP (and to the owners of the equity).
d. Fully $1.2B of debt will not mature until 2036, essentially an eternity away.
e. In essence, JCP will need to manage about $233M in debt redemptions (including seven remaining quarterly payments on the 2016 Facility summing to about $73M) before year-end 2020. Even as I expect CFFO and FCF to continue to trend down as it has, JCP should be able to manage these redemptions through 2020. In that case, there should be the ability for JCP to maintain operations into 2023.
So in the case that there would be no bankruptcy filing, this investor will secure a 33% cash yield on the investments made recently in JCP Exchange-traded Debt (in my case, I am buying KTP), out to the horizon.
However, few readers are believing that there will be no filing.
So what is the potential for a recovery for unsecured holders?
Here is one view from the "Tariffs" article above:
So one view, apparently a common view based upon market price, is that there is no recovery potential in J. C. Penney.
Let me beg to differ.
I remember when everyone was predicting that "Sears and JCP" would go into bankruptcy. For Sears, "that was ok" as Sears had the real estate that was the real target anyway. So with JCP owning "big boxes" in a statistical distribution of locations similar to Sears, why does everyone focus on a Sears recovery, but no one looks at one for JCP on the same basis?
JCP still owns $3.7B in book value real estate property. J. C. Penney runs 847 stores, comprising 95M square feet, and owns 402 of those stores. Averaging those numbers, JCP owns 45M square feet of "big box" real estate (let's just forget about the 9M square feet at the six distribution centers owned by JCP and value those at zero for the sake of the argument, representing upside on this analysis).
I recognized that there would be substantial debate about the value of JCP real estate, with estimates of recovery value from zero (or negative) to double what it was worth. However, there is a market surrogate from which a market value (enterprise value) could be determined to represent a fair measure of value, based upon a valuation by Mrs. Market at this moment.
That would be to use the market value for Seritage, representing a portfolio of "big boxes" like those owned by JCP having a distribution across the country similar to JCP, and calculate an enterprise value per square foot to use as a reasonable (unemotional) estimate for the recovery value for JCP real estate.
So here is a calculation of "current" enterprise value of Seritage, based upon their Q1'19 report and the market price of Seritage (
SRG
) at the market close on Friday, May 31st, 2019:

So, adding in the market price of the two common shares series (assumed B series at same value), preferred shares at liquidation value and debt at Q1'19 levels, one can calculate an Enterprise Value for Seritage. Dividing the Enterprise Value by the total area allows one to calculate an EV/sq foot of $90.35. Applying this to the estimated 45M square feet of JCP real estate (847 stores with 95M square feet, with 402 owned, so 402/847= 47.5% of 95M or 45M) and one calculates a $4B recovery on this real estate. One could do the same for the distribution centers (comparing it to benchmark REITs owning predominantly industrial/distribution center properties) and this would bolster recovery by 15% or so, as I anticipate that they have a lower value per square foot.
I did not use inclusion of the value of the OP Units as that would have driven up the recovery more, as one can see here:

So I have focused exclusively on valuations based upon the publicly traded shares as that generates a lower recovery calculated, still high enough to make the essential point about recovery for the unsecured debt.
The debate will begin about whether this is a fair representation of JCP real estate or not. The essential point is not whether JCP real estate is $4.2B or $3.8B and whether the recovery is 90% or 110% as that level of specificity cannot be identified until one looks at the detail at the time of filing.
The essential point is that there is likely a substantial, if not full, recovery in a legally supervised reorganization for the unsecured debt in the case that a filing takes place. The liabilities of $4B in debt and $0.9B in accounts payable to vendors is offset by $0.2B in cash, arguably $0.4B in recovery from current inventory at a 15% recovery rate on existing merchandise (a typical estimate in my experience) along with the $4B in "big box" real estate (with another $0.5B in distribution center recovery, if needed).
A 90% or 110% or 82% recovery is arguable, in my view. A zero recovery is unsubstantiated and, in my view, not a reasonable basis for estimating terminal recovery.
Anything can happen when investing in distressed assets, but this analyst disagrees with the market view, as well as other SA contributors, that a filing is necessary in the next three years. This analyst views a 2019 or 2020 involuntary filing as unnecessary and a voluntary filing as unlikely (and would be challenged as such). Even if there were a short-term filing, substantial recoveries would still provide strong returns on these securities.
Therefore, this analyst increased the position in J. C. Penney exchange-traded Debt Security KTP on May 31st by a third, increasing it to about 20% of assets in the Risk Portfolio. In addition, over the next few months, additional purchases are planned as funds become available if prices remain in this range.
At the current price (using the $5.75/KTP limit order price as the benchmark), KTP delivers 16.5% of the original purchase price back each semi-annual pay period. I expect to see a minimum of five payments (83% of my purchase cost) and up to eight (132% of my purchase price) before a point of an involuntary filing can be reasonably expected (triggered by an inability to redeem an upcoming maturity).
If a bankruptcy does not materialize, the owner of KTP will receive 33% coupons out to 2097. Mrs. Market does not view this as likely, but it does remain an option, even if low probability at this point.
More to the point, if a bankruptcy were to occur as currently expected, the owner of KTP will go into the restructuring with a basis (if it were after five payments in 2022) of $0.98/KTP share. At an 80% recovery, there would be a 20:1 payout on that $1 basis in an anticipated restructuring period of three years. Indeed, if the bankruptcy were to occur after 6 interest payments, the basis for the investor at these prices is zero so any recovery is upside from that point.
This analyst loves those odds and is happy to buy what you are selling.
Additional disclosure:
No guarantees or representations are made. The Owl is not a registered investment adviser and does not provide specific investment advice. The article is for informational purposes only. You should always consult an investment adviser.
I am/we are long KTP.
I wrote this article myself, and it expresses my own opinions. I am not receiving compensation for it (other than from Seeking Alpha). I have no business relationship with any company whose stock is mentioned in this article.
推荐文章
美股机会日报 | 止跌企稳!纳指期货盘前涨约0.5%,有分析称美股连遭重挫后或回升;亚马逊盘前大跌超8%

一周财经日历 | 事关降息!美国1月非农、CPI数据下周公布;恒指季检结果下周五揭晓
华尔街大多头漫谈黄金“黑天鹅”风险:马斯克实现太空采金,化身全球央行行长
避险情绪席卷市场 华尔街青睐的热门交易纷纷崩跌
华盛早报 | 无一幸免!美股、金银、加密货币与原油集体崩盘;南向资金爆买250亿港元!创约半年来新高;千问APP今日启动30亿免单
亚马逊股价盘后大跌近10%,巨额资本支出引发担忧
比特币暴跌带来124亿美元巨亏 Saylor的金融实验岌岌可危
2月6日外盘头条:比特币暴跌 亚马逊预计今年资本支出将达2000亿美元 交易员料美联储将比预期更早降息
