热门资讯> 正文
Frenetic Week Ends With Record Highs
2019-11-02 13:35
The busiest remaining week of 2019 appropriately ended with some fireworks with the S&P 500 and Nasdaq setting new all-time record highs, each gaining more than 1.5%.
Economic data this week indicated that the US economy is on better-footing than once thought, a continuation of the “Goldilocks” conditions that are ideal for commercial and residential real estate.
Nonfarm payrolls data showed that hiring remains solid despite the clear trade-related slowdown in the goods-producing and manufacturing sectors. Services-sectors have picked up the slack in 2019.
Income growth has remained resilient over the last quarter as well. Real personal incomes rose 3.5% in October, the strongest rate of inflation-adjusted growth since December 2018.
Housing data, including better-than-expected Pending Home Sales and home price data, provided more evidence of a continued reacceleration of the single-family housing market into year-end.
Perhaps the busiest remaining week of 2019 appropriately ended with some fireworks with the major US equity indexes ending at new all-time record highs. The stars aligned for a seemingly endless flurry of economic data and earnings reports that included the monthly job report, the first look at third-quarter GDP, more than 140 S&P 500 earnings results, and the critical Federal Reserve rate decision. Overall, economic data this week indicated that the US economy is on better-footing than once thought, a continuation of the “Goldilocks” conditions of slow but steady economic growth and muted inflationary pressure that is ideal for commercial and residential real estate equities.
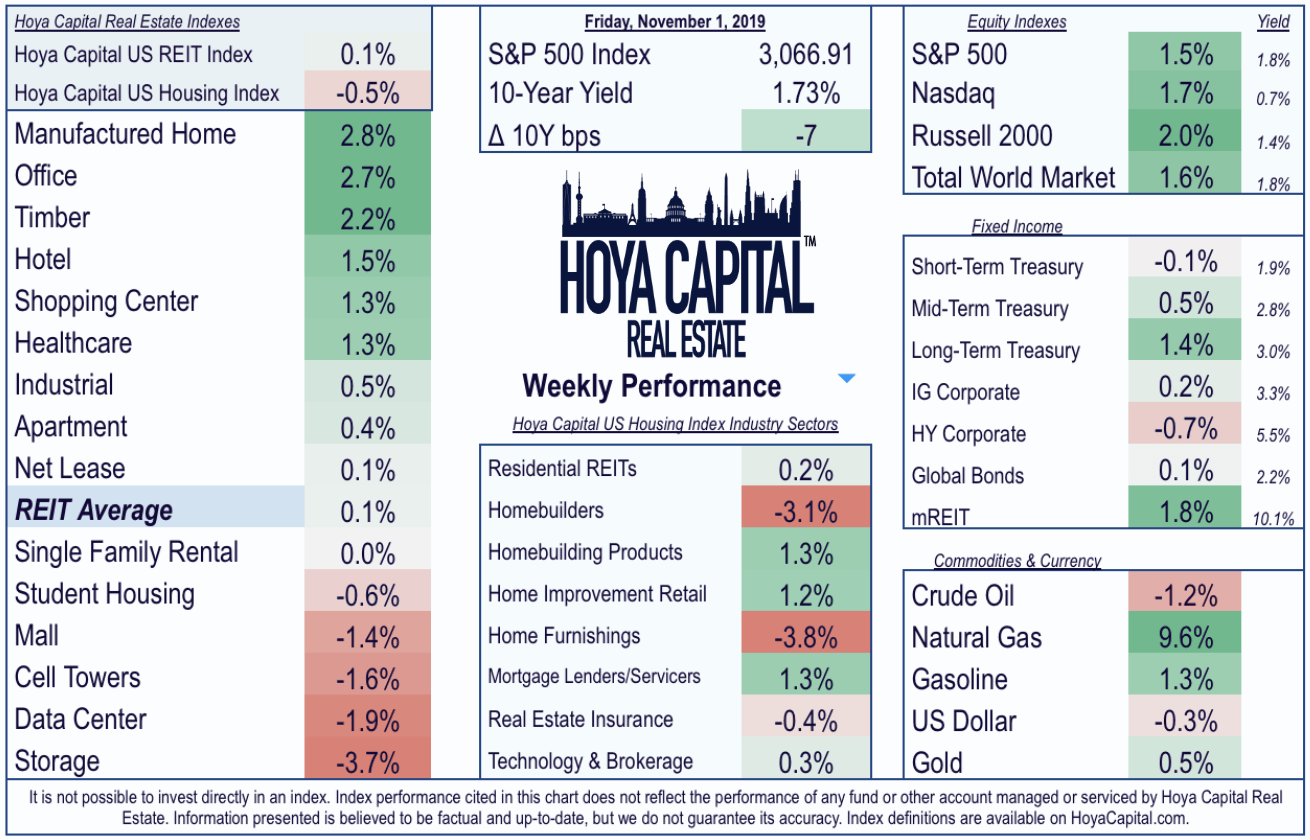
Producing most of this week's gains immediately following the better-than-expected jobs report on Friday, the S&P 500 ETF (SPY) and Nasdaq ETF (QQQ) climbed 1.5% and 1.7%, respectively on the week. On the busiest week of real estate earnings season, the broad-based Real Estate ETF (VNQ) ended the week mildly higher, closing just shy of new all-time record highs as well, gaining 0.1% and led to the upside by the manufactured housing, office, and timber REIT sectors. Cooler-than-expected inflation data and Fed Chair Powell's fairly dovish commentary following the Fed's 25 basis point cut sent the 10-Year Treasury Yield (IEF) lower by 7 basis points to end the week at 1.73%.
Following last week's record-high close, the Hoya Capital US Housing Index, the benchmark that tracks the performance of the US Housing Industry, finished the week lower by 0.5%. Strength in the homebuilding products and home improvement retail sectors was offset by selling in the two highest-flying housing sectors this year, the homebuilders and the home furnishings sectors. Homebuilding products firms Leggett & Platt (LEG), Simpson Manufacturing (SSD), and Masco (MAS) were among the week's winners. While homebuilders MDC Holdings (MDC) and Taylor Morrison (TMHC) lagged following earnings that didn't meet analyst's sky-high expectations.
Below we compiled the notable earnings that we're watching across the residential and commercial real estate sectors. Highlights of next week's slate include some reader favorites including Realty Income (O), QTS Realty (QTS), Spirit Realty (SRC), Omega Healthcare (OHI), Verreit (VER).
As discussed, it was the busiest week of earnings season for the REIT sector with more than 60 REITs reporting results. Despite the flurry of earnings, the biggest news of the week came in the form of M&A with industrial REIT stalwart Prologis (PLD) announcing a deal to acquire Liberty Property Trust (LPT) in an all-stock deal valued at about $12.6B. The next day, data center REIT Digital Realty (DLR) announced a deal to acquire European data center operator Interxion (INXN) in an $8.4B deal which will significantly expand DLR's global data center platform.
Following a couple of so-so jobs reports this summer, the BLS reported that total nonfarm payrolls rose 128k in October, higher than estimates of 85k. More impressive was the 95k in net revisions to prior months, which was significant enough to force economics to question the prevailing narrative that employment growth was deteriorating into year-end. A slow but steady uptick in labor force participation has been behind the recent strength. At 3.6%, the unemployment rate ticked up a tenth after hitting the lowest rate in 50 years. African American unemployment hit another record low at 5.4%
The story of the last year's economic reacceleration was a resurgence in the long-dormant goods-producing sectors. Manufacturing jobs, which had entered a mild recession in 2016, saw significant growth in 2018 but have slowed over the past two quarters. Year-over-year job growth in the goods-producing sectors slowed to 0.9% from a peak of 3.3% last September. Construction added 10k jobs last month while manufacturing, which was negatively impacted by the GM autoworkers strike, lost 36k. The mining and logging industry saw flat net job growth in October. Goods-producing sectors subtracted 26k jobs from the 128k total jobs added in October.
Job growth in the services sectors, which accounts for roughly 85% of total jobs in the US, has trended sideways since early 2017, but had seen several solid months of growth since late 2018 and have recorded 1.5% year-over-year growth. Retail hiring finally recorded a positive month 6k jobs added in October amid an otherwise dismal year for a retail sector that has exhibited signs of a "double-dip" following a brief recovery after the so-called "retail apocalypse" of 2016-2017. Hiring in the professional services and healthcare categories has seen solid and accelerating growth since late 2016, which added 22k and 34k jobs last month, respectively. Private services-producing sectors contributed 157k jobs to the 128k total jobs added in October. Government hiring subtracted 3k from the total figure.
The traditional measure of unemployment, the U3 unemployment rate, ticked up to 3.6% from 50-year lows of 3.5% while the U6 rate ticked also ticked up to 7.0% from 6.9%. Household data, which has shown far more impressive growth in hiring than the establishment survey over the last several months, showed another impressive 241k rise in employment and a 325k rise in the overall labor force. The participation rate rose to 63.3%, setting a new post-crisis high. As we have discussed for the last three years, we continue to believe that there is significantly more labor market slack remaining in the labor market than traditional metrics would imply, slack that has begun to be unleashed by continued wage growth and policy changes that reduce disincentives to employment.
Despite the historically low unemployment rate, wage growth remained solid but in-check in October with average hourly earnings rising 3.0% year-over-year, exactly in-line with estimates. Lower-income jobs, however, continue to see wage growth above the broader averages. Real wage growth, as measured by real average hourly earnings or real disposable personal income per capita, has been near cycle-highs for most of this year. Core PCE inflation data released last week showed that core inflation rose 1.7% last month, as inflationary pressures remain muted after a brief inflation scare in 2018.
Despite the growing drumbeat of recession warnings from the financial and mainstream media, the US consumer has shown signs of resilience in the face of slowing global growth. Consumer spending, which represents roughly two-thirds of US GDP, has shown signs of strength and perhaps even early signs of reacceleration, following a slowdown in the second half of 2018. Personal income and spending data released this week in a seperate report from the BEA was generally better-than-expected with personal incomes rising 4.9% and personal spending growing 3.85%, rates of growth that are each still above the post-recession average. Real personal incomes rose 3.5% in October, the strongest rate of inflation-adjusted growth since December 2018.
Home price data via the S&P Case Shiller Index was also released this week. Home price appreciation moderated meaningfully from mid-2018 through early 2019, but has shown early signs of stabilization and even reacceleration in recent months amid a favorable backdrop of lower mortgage rates. National Home Prices rose 3.2% from last year, up from 3.1% in the prior month, the first sequential uptick since early 2018. Home price gains have been strongest in the lower price-tiers outside of the major metropolitan markets.
As shown below, of the various measures of income growth, home price appreciation has tracked disposable personal income per capita growth most closely over the past three decades. By this measure, home prices have generally outpaced income growth in the post-recession period amid a lingering undersupply of housing in many major markets, but home prices are not terribly out of line with income growth. Since 1995, home price appreciation has actually lagged nominal growth in personal income, suggesting that affordability issues may not be quite as significant as commonly believed.
On Tuesday, the National Association of Realtors reported that Pending Home Sales beat estimates in September, rising by 3.9% on a year-over-year basis. This rate of annual growth was the largest annual increase since 2015, providing another piece of evidence that we are indeed seeing a sustained acceleration in the single-family home sales markets following the worst year for the sector since the end of the recession. In the prior week, New Home Sales surged 15.5% from last year.
Typically the headline data report of the week, quarterly GDP data took a back seat this week, but nevertheless was a notable report on a number of fronts. The annualized rate of real GDP grew by 1.9% from last quarter, beating consensus estimates of 1.6%, but matching the second-slowest quarterly rate of growth since 2015. Signs of life emerged in the latest GDP report, however, as stronger-than-expected consumer spending and an uptick in residential fixed investment provided reasons for optimism into the end of 2019. The closely-watched final domestic demand figure rose by 2.0% from last quarter, while personal spending jumped a solid 2.9%. Inflationary pressures remain muted with core PCE prices rising 2.2% in the third quarter.
Growth in residential fixed investment had been a drag on GDP growth for six consecutive quarters, but turned positive this past quarter, consistent with the reacceleration in single-family homebuilding. Fixed investment in non-residential structures, however, continues to be a drag on total GDP Growth, subtracting 0.5% from the quarterly figure. For context, these two categories combined boosted GDP by 1.3% at the peak in 2002 and dragged down GDP growth by 1.1% at the bottom in 2008. A tailwind for REITs and real estate asset owners, supply growth has cooled even as demand remains solid.
Looking at this data through another lens, we see that residential fixed investment as a share of GDP remains well below the pre-recession period. On a rolling 10-year average, residential fixed investment as a share of GDP is barely above the lowest since the end of WWII, a function of underinvestment in both new home construction and existing home repair and renovation activity. The surge in residential investment fueled the housing bubble in the mid-2000s and was responsible for 6.6% of GDP in 2005. Residential fixed investment now makes up just 3.7% of GDP while business non-residential investment in structures makes up 3.0% of GDP.
Last but not least, the US Census Bureau released its quarterly Housing Vacancies and Homeownership data this week as well. Headling that report was data that showed that the homeownership rate unexpectedly jumped to match the highest rate since 2014 as household formations remain strong. Consistent with the demographic trends we've discussed, we forecast a steady uptick in the homeownership rate over the next decade as millennials - the largest generation in American history - begin to enter "ownership age." The under 35 year-old ownership rate surged to the highest since 2011.
Gains in the homeownership rate, however, did not come at the expense of the rental markets. Housing markets remain historically tight as the vacancy rate for both rental and owner-occupied units remains at or near 40-year lows. The rental vacancy remained steady at 6.8% in the third quarter, still just 20 basis points above 40-year lows. The homeowner vacancy rate climbed 10 basis points to 1.4%, ticking marginally higher from last month's 1.3% rate, which was the lowest rate since 1981.
Instead, gains in the homeownership rate came as a result of gains in total household formations. Total household formations rose by nearly 2% in 2018, the strongest year for formations since 1985, and solid growth has continued into 2019. At 123.1 million households in September, household formations rose 1.5% from the prior year, near the upper end of the historic range. Given the abnormally large 5-year cohort of 25-29 year-olds, we think that the household formation rate will see continued gradual increases over the next five years as this "mini-generation" enters prime first-time homebuying age.
A theme we discuss extensively is the effects of this housing shortage, which has manifested in a persistent rise in overall housing costs. Housing inflation has outpaced the broader inflation rate on a year-over-year basis in 90% of months since 1995 and does not show signs of receding anytime soon. Housing accounts for a third of average consumer spending and the "wallet share" of housing and housing-related services have increased significantly over the last decade. Given the still-slow growth in housing starts and modest gains in residential fixed investment this year, combined with favorable demographics for household formation growth, it appears that that rising housing costs will continue to be a theme well into the next decade.
Despite this week's underperformance, the broad-based REIT ETFs have gained more than 26% this year on a price basis, continuing to outpace the S&P 500, which has climbed by roughly 22%. The US Housing sector has climbed 31% this year with particularly strong performance from the single-family homebuilders. Not all real estate sectors are seeing the windfall, however, exhibited by the 63% performance gap between the best- and worst-performing REIT sector. At 1.73%, the 10-year yield has retreated by 96 basis points since the start of the year and is roughly 150 basis points below peak levels of 2018 around 3.25%.
This week, we published our analysis on the manufactured housing REIT sector: Ground Zero Of The Affordable Housing Shortage. Beat, Raise, Repeat. The manufactured housing REIT sector delivered another stellar quarter in 3Q19 and is on track to outperform the broader REIT index for a remarkable seventh straight year. 2019 was poised to be the year where cracks in the story began to emerge for Equity Lifestyle (ELS) and Sun Communities (SUI) as manufactured housing and RV home sales showed notable slowing early in the year. Instead, the tailwinds of accelerating blue-collar wage growth and the lingering and mounting affordable housing shortage continue to support robust rent growth and occupancy levels.
Following this week's flurry of economic data, the week ahead will be quiet on the data-front. Factory orders will be released on Monday and JOLTs jobs data comes out on Tuesday. It'll be another busy week of earnings, however, with more than 30 REITs and housing-related companies reporting results next week and nearly 100 S&P 500 companies.
If you enjoyed this report, be sure to "Follow" our page to stay up-to-date on the latest developments in the housing and commercial real estate sectors. For an in-depth analysis of all real estate sectors, be sure to check out all of our quarterly reports: Apartments, Homebuilders, Student Housing, Single-Family Rentals, Manufactured Housing, Cell Towers, Healthcare, Industrial, Data Center, Malls, Net Lease, Shopping Centers, Hotels, Office, Storage, Timber, and Real Estate Crowdfunding.
I am/we are long LEG, SSD, TPX, RMAX, MAS, MIDD, NLY, WY, SUI, MAA, DLR, PLD.
I wrote this article myself, and it expresses my own opinions. I am not receiving compensation for it (other than from Seeking Alpha). I have no business relationship with any company whose stock is mentioned in this article.
Additional disclosure:
It is not possible to invest directly in an index. Index performance cited in this commentary does not reflect the performance of any fund or other account managed or serviced by Hoya Capital Real Estate. All commentary published by Hoya Capital Real Estate is available free of charge and is for informational purposes only and is not intended as investment advice. Data quoted represents past performance, which is no guarantee of future results. Information presented is believed to be factual and up-to-date, but we do not guarantee its accuracy.
Hoya Capital Real Estate advises an ETF. In addition to the long positions listed above, Hoya Capital is long all components in the Hoya Capital Housing 100 Index. Real Estate and Housing Index definitions and holdings are available at HoyaCapital.com.
推荐文章
美股机会日报 | 止跌企稳!纳指期货盘前涨约0.5%,有分析称美股连遭重挫后或回升;亚马逊盘前大跌超8%

一周财经日历 | 事关降息!美国1月非农、CPI数据下周公布;恒指季检结果下周五揭晓
华尔街大多头漫谈黄金“黑天鹅”风险:马斯克实现太空采金,化身全球央行行长
避险情绪席卷市场 华尔街青睐的热门交易纷纷崩跌
华盛早报 | 无一幸免!美股、金银、加密货币与原油集体崩盘;南向资金爆买250亿港元!创约半年来新高;千问APP今日启动30亿免单
亚马逊股价盘后大跌近10%,巨额资本支出引发担忧
比特币暴跌带来124亿美元巨亏 Saylor的金融实验岌岌可危
2月6日外盘头条:比特币暴跌 亚马逊预计今年资本支出将达2000亿美元 交易员料美联储将比预期更早降息
